Simple investing for smarter investors
Invest in dozens of themed portfolios
with just a $100 minimum.
Sign up
with just a $100 minimum.

Let's get you started. Invest in...

A portfolio for you
Based on your preferences

Top performing portfolios
5 portfolios

Undervalued companies
5 portfolios

Growth
5 portfolios

Income generating portfolios
5 portfolios

Better planet
5 portfolios

Social justice
4 portfolios

Responsible management
4 portfolios
Not sure where to start? Let us create a portfolio for you

Convenience and care
Your account is transparent to you and controlled by you. We oversee and provide unlimited support at all times.
Learn more
Low, fair fees
You pay asset management fees of 0.10% to 0.75% per year on your investments. There are no trading commissions.
Learn more
Invest without limits
Easily upgrade at anytime to an Interactive Brokers Account to trade stocks, options, futures, bonds and ETFs on your own.
Learn moreRecent awards
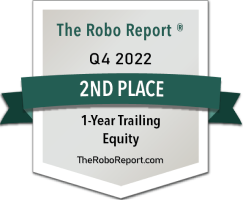


Notes on awards
cancelGet invested
STEP
1
Fill out the application
It's easy and only takes a few minutes.
STEP
2
Explore our portfolios
Or choose one based on your preferences
STEP
3
Make your 1st investment
Our technology ensures it is suited for you